
- The project has developed a model that predicts the probability of the presence of tiger mosquitoes in areas of Spain where there are participants with the Mosquito Alert app installed.
- The model is updated weekly and generates monthly estimates of the probability of finding tiger mosquitoes in a given area.
- It has been elaborated from the observations sent by the participants with the Mosquito Alert app.
More than 55,000 people have participated in Mosquito Alert since the project began in 2014 and more than 12,000 observations sent as tiger mosquito have been received, according to the data recorded. The great challenge of this citizen science project was to make predictions of this invasive species with the collaboration of the citizens. Now, the team has developed a predictive model based on citizen data that is integrated into the observation map of Mosquito Alert with a new element in the legend called “Available models for tiger mosquito probability”. This work has been possible thanks to the collaboration with Dipsalut – Public Health Agency of the Diputació de Girona, to get a useful tool for the territory in order to manage the health risk by mosquitoes transmitting diseases.
As explained in the scientific embryo of this model, published last October of 2017 in the journal Nature Communications, this tool generates estimates the probability of tiger mosquito presence. This alert represents the probability that a participant sends a reliable tiger mosquito report during a two-week period controlling the sampling effort. This means that the model incorporates the fact that there are more participants in some areas than in others. These estimates are displayed in a grid of 0.05 degrees of latitude by 0.05 degrees of longitude (4 km2 approximately) and are averaged per month. Estimates are updated weekly as new data is entered.
This probability of alert depends on three factors. On the one hand, the abundance of mosquitoes, which varies according to the location and the month. On the other hand, the presence of participants in a certain area, which is understood as the sampling effort. Finally, it also depends on some patterns of variability in the use of the app. Thus, the model is constructed from these considerations but also takes into account reliable citizen observations validated by the experts. In addition, for example, it is assumed that a tiger mosquito observation without a photograph that can not be validated by entomologists is more likely to be a tiger mosquito if it has been sent close to other observations with a photograph in space and time and that were classified as tiger mosquitoes. Therefore, this type of data is also considered “trusted” for the model. In this first phase, the model does not include climate or environmental information, but only models a probability of alert eliminating biases inherent to the collection of citizen data.
Why a model?
The model allows all the available data to be used so that the information in a specific place and time is more precise. Thus, the model better estimates what may be happening in a territory in which there are participants but there is not much data available. For example, if in a single place we have a single observation, the model will use the surrounding and past information to establish a probability and associate an uncertainty, so that more is known. In the future, we can also make tiger mosquito probability estimates in areas where there are no participants, although we hope that the participation in the project will continue to grow and these areas will be minimal.
It has been shown that this alert probability is a good predictor of the presence of the tiger mosquito as measured by traditional surveillance methods, as explained in the Nature Communications publication. The model was compared with data from tiger mosquito oviposition traps that were distributed throughout the eastern and southern Spain during 2014 and 2015. The result was the result of the production of the model. And the prediction potential to those made with traditional methods.
How to interpret the map with the predictive model
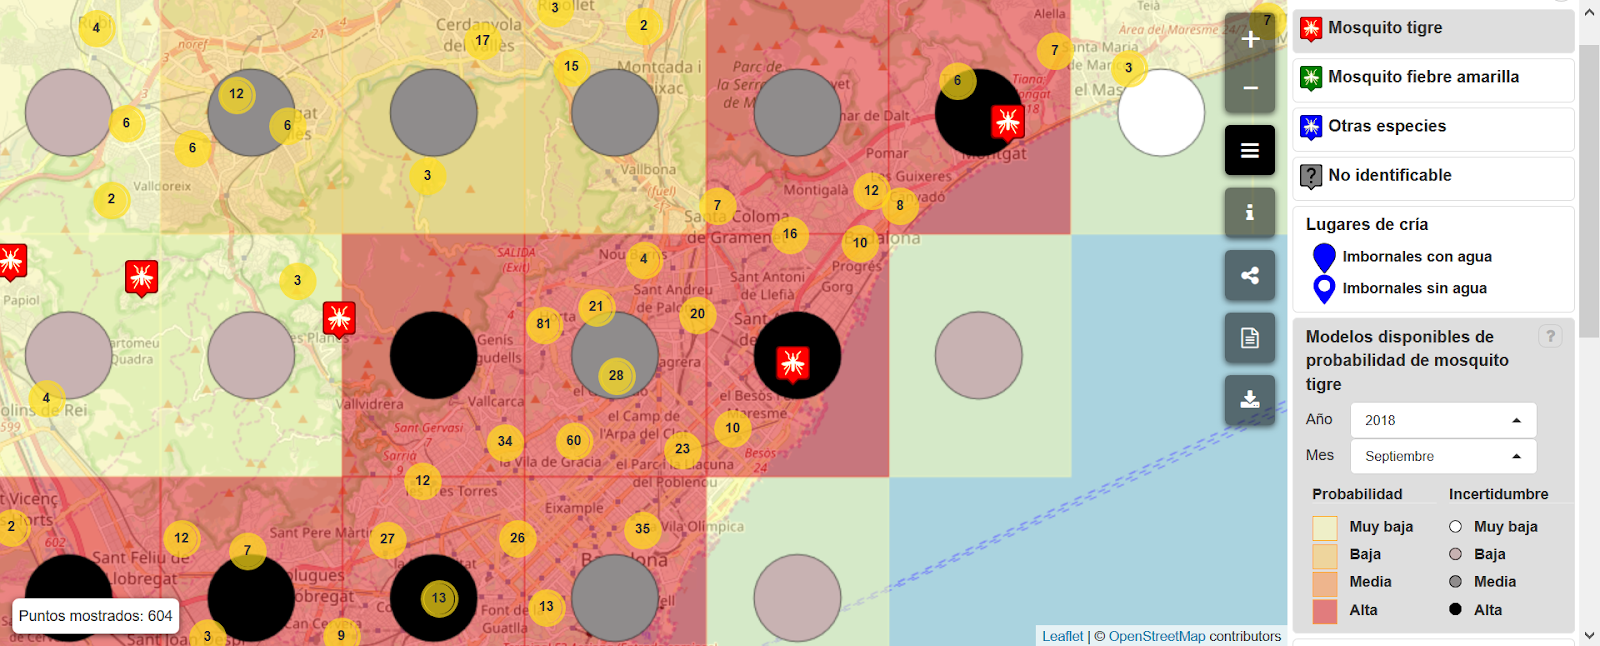
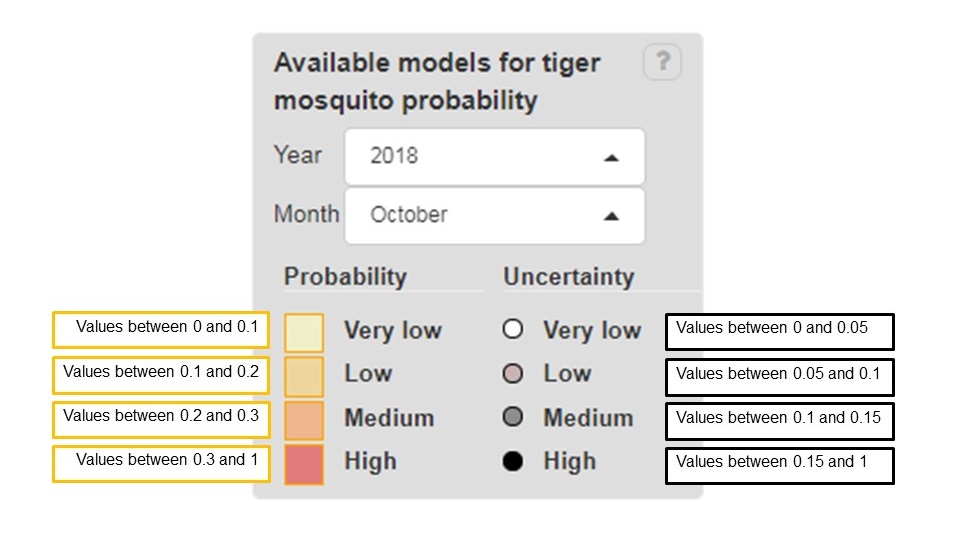
The map shows the average probability of having a tiger mosquito and the uncertainty associated with this probability in a grid of approximately 4 km2. To visualize these values in the form of grids on the map, select the “Probability Mosquito Tiger” tab. The color of the grid represents the probability level of the tiger mosquito and the color of the points indicates the uncertainty associated with the area within the grid. Both values are shown on a scale of 4 levels (very low, low, medium and high) whose probability ranges can be seen by passing the cursor over each element of the legend. These probability ranges have been defined to better visualize the differences in value between cells and, therefore, the range of values defined by each class is not constant.
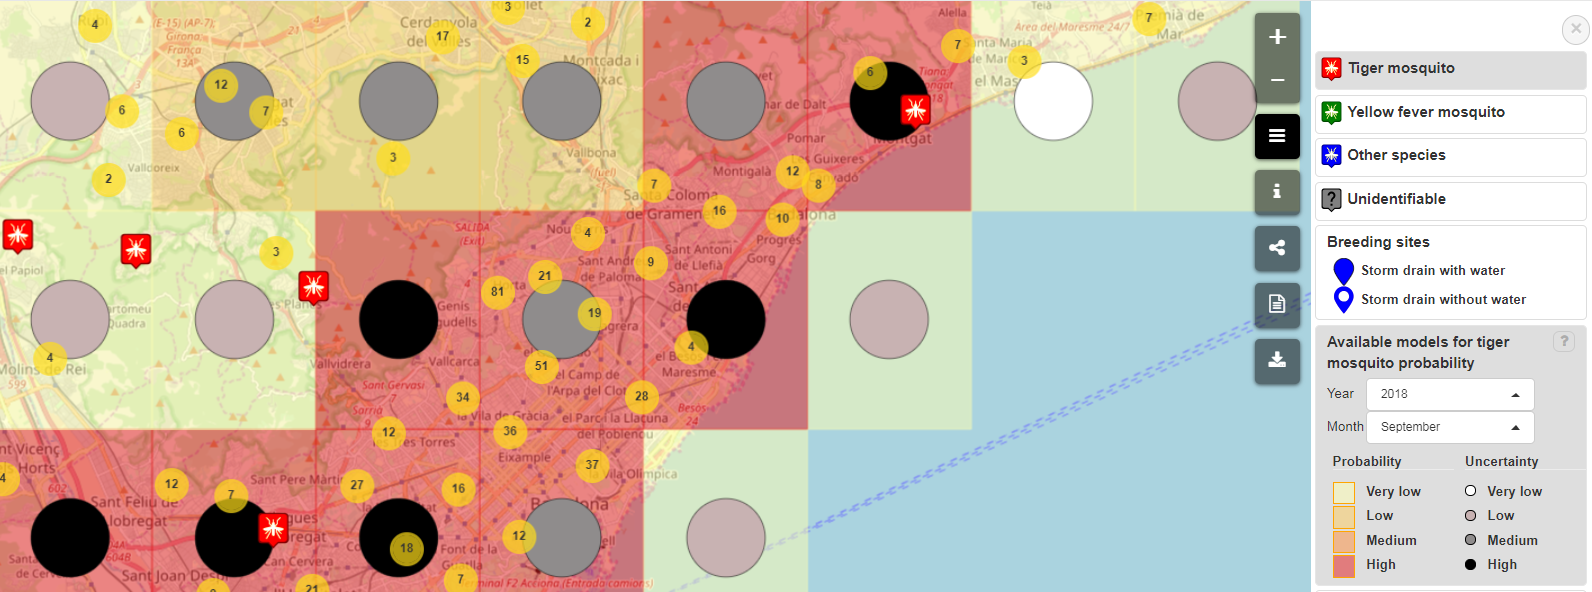
Let’s see an example:
The figure below shows that the alert probability is usually high in the cells where there are more reports and low in those where there are few. In general, this happens but not always, since the model eliminates certain biases in the data and this makes the correspondence between the number of reports per cell and the probability not so direct but depends on other factors. If we see the values that represent each class, for example a cell with a high probability value and a very low uncertainty value, it means that there is an average probability between 0.3 and 1 that in this cell a participant has sent at least one photograph of tiger mosquito during the two weeks prior to the day in question. However, the data that supports this evidence are very few or nonexistent, so the level of uncertainty would be low (between 0.05 and 0.1).
Seasonal and territorial variations
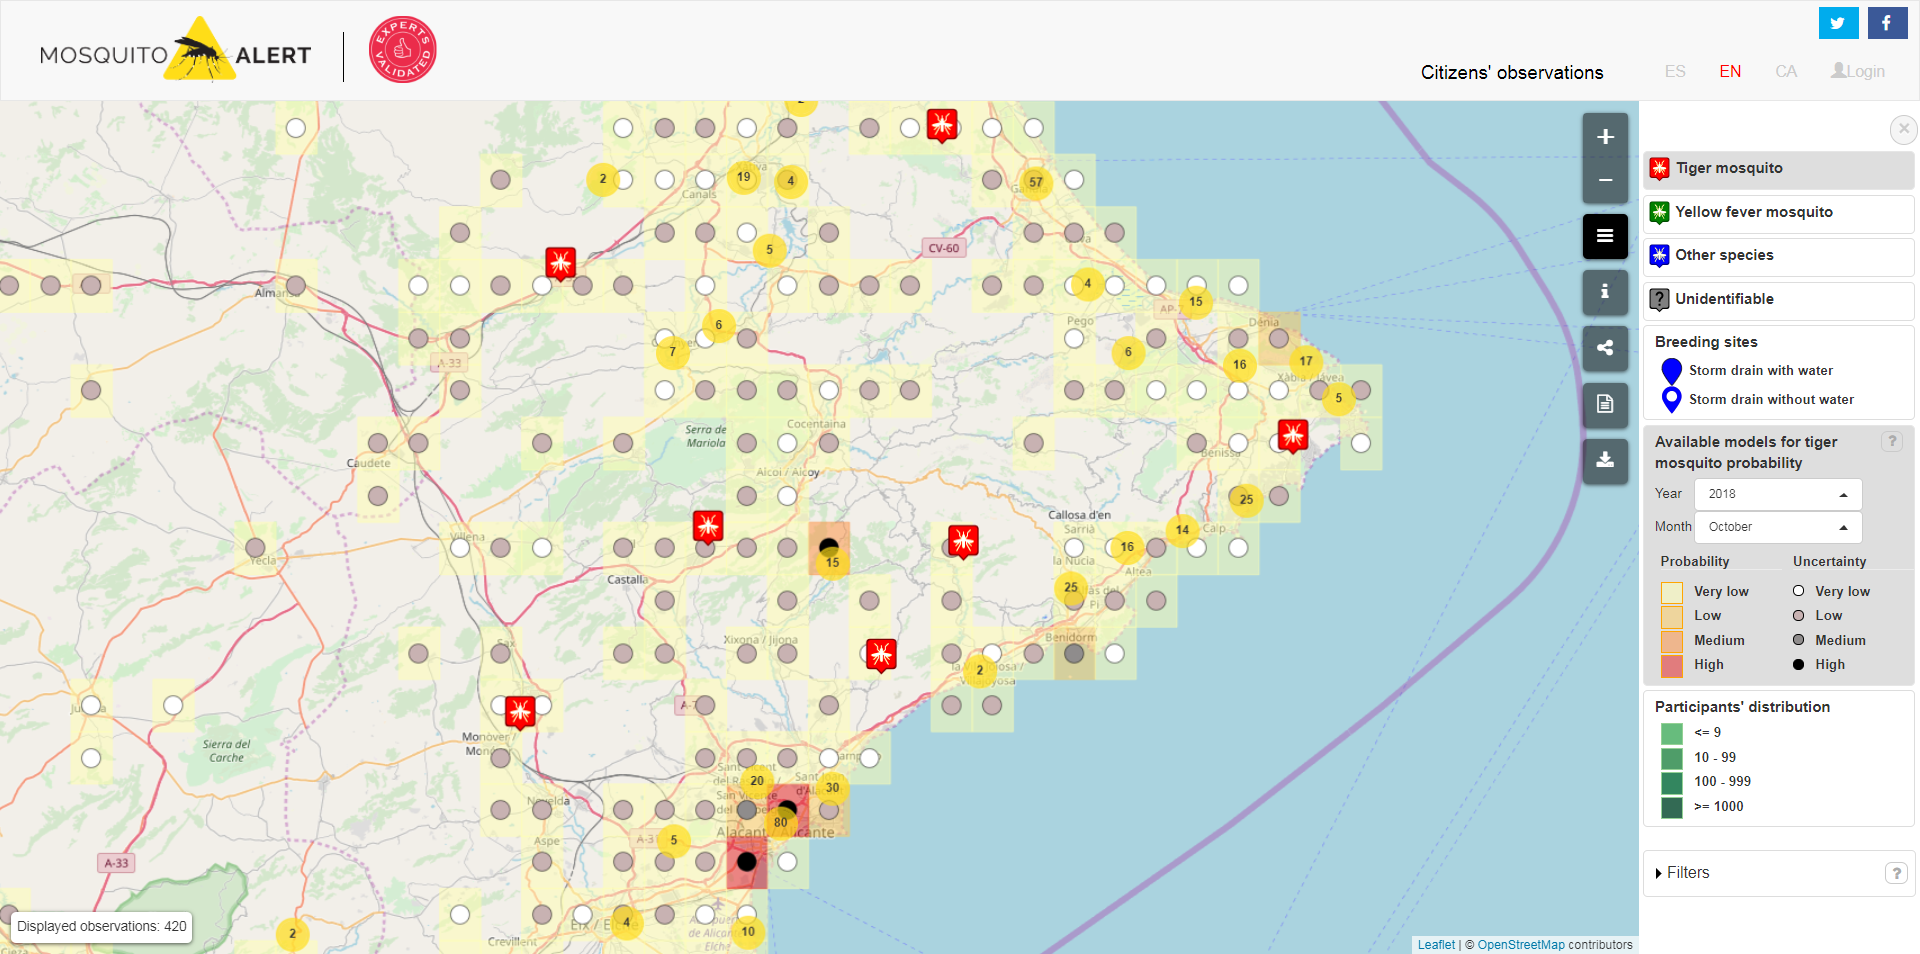
The tiger mosquito is a species with a very marked seasonal cycle and the abundance of its population varies greatly at different times of the year. In addition, it is not distributed in the same way throughout the Spanish territory, since in some areas it is established and in others it has not yet been detected.
To improve our current estimates it is crucial to increase both the number of participants and the number of reliable reports to cover the sampling effort in the cells without participation and the cells where there are few or none. In this way, the seasonal and territorial variability of the tiger mosquito will be better reflected at all scales and could begin to make seasonal predictions.
More information:
- The details of the model can be consulted at: John R.B. Palmer et al. (2017). Citizen science provides a reliable and scalable tool to track disease-carrying mosquitoes. Nature Communications 8:916. DOI: 10.1038/s41467-017-00914-9
- The data used and the model code are available at Zenodo platform.