Interactive and in real time
Consult, analyze, download and share the observations made by citizens
All mosquito photos received are analyzed and validated by the Mosquito Alert team of expert entomologists. Once the mosquito species has been confirmed, the observations are made public on the map with their result. Notices of breeding places on public roads are also represented in this interface.
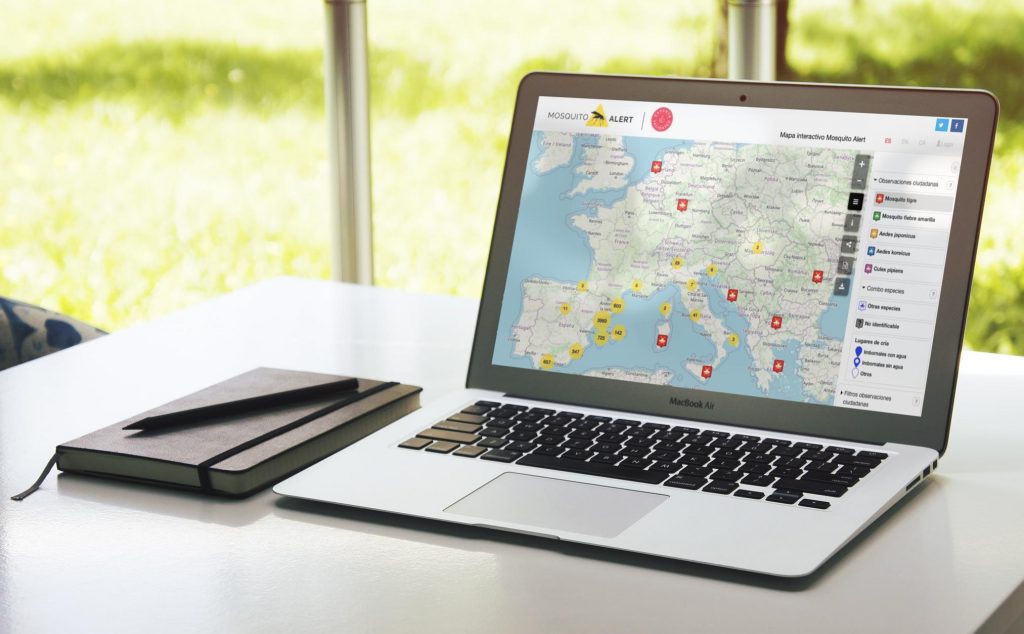
The Mosquito Alert public map allows you to view the data, filter it by year, month, range of days and provinces, prepare a personalized report and download the data to analyze it.
Where are mosquitoes found?
The map contains observations of mosquitoes and breeding sites from 2014 to the present day, incorporating daily reports validated by experts. Observations of five mosquito species can be viewed:
- Asian tiger mosquito (Aedes albopictus)
- Yellow fever mosquito (Aedes aegypti)
- East Asian bush mosquito (Aedes japonicus)
- Aedes koreicus
- Common house mosquito (Culex pipiens)
There is a “combo species” category that includes two species of mosquitoes that are very similar to each other. When the experts fail to appreciate in the photos the character that differentiates both species, the observation is classified as a “combo species“.
Where are their breeding places?
Breeding places on public roads are represented on the map grouped into three categories: storm drain with water, storm drain without water, and others,.
Filter the data
All this data can be filtered by year, month, select a custom date, limit to a specific municipality, or search for a specific hashtag. If you add a note with a hashtag to your observations, you can easily locate them on the map.
Predictive models
Mosquito Alert has developed models that predict the probability of encountering a tiger mosquito (Aedes albopictus) or an East Asian bush mosquito (Aedes japonicus) in an area. Monthly predictions are based on past observations for that month, and are updated in real time with current year’s observations. The models take into account the number of devices with the Mosquito Alert app in the area and the quality and quantity of reports sent.
Sampling effort
Allows you to view the distribution of users of the Mosquito Alert app in a 2×2 km grid. The intensity of the color indicates a greater number of participants or who have spent more time in the area. Knowing the distribution of the participants is important in order to develop predictive models and in future to develop models of risk of disease transmission. Without this information it would not be possible to know if there are a lot of mosquitoes or a lot of participation in an area. In ecology this data is known as “sampling effort” and allows the observations to be corrected to make them comparable between areas.